


Monitoring utility use and cost – for either your home or your House of Worship (HOW) --is an important first step toward conserving energy, reducing your carbon footprint and saving money! Monitoring utility use tells exactly what type of energy is consumed, what months it is consumed in and this in turn helps identify which energy usage areas you should focus on to find the highest potential cost savings and reduction in carbon emissions. This is also a great way to prepare for an energy assessment: the assessor can look at high energy use areas to make the most relevant recommendations.
Remember, stewardship is what we do. Cost is the consequence of what we do. And with energy, cost is more than just money; it is also the contribution to climate change that we make when we use energy. The extreme weather that climate change causes impacts people around the world and will impact future generations, so we need to do what we can to reduce our energy use.
A good and easy way to monitor energy use is to use MassIPL's Utility Use & Cost spreadsheet for electricity, oil, gas, propane and water.
Knowing a home's or HOW's utility use and cost is easy: you can call your electric or gas company's customer service number, give them your account number and the company will send a monthly record of the past 2 – 3 years to you. If your utility company does not offer a history, then getting information from monthly bills is the only alternative. (Some bills have your last 12 month's usage in them for reference). Your community's Public Works Department or water company will be able to give you your water usage history. Because seasons vary year to year, it is important to get three years of utility use data so you can identify trends.
The MassIPL spreadsheet has individual worksheets for each utility: electricity, gas, oil, propane, and water. We know spreadsheets can be somewhat intimidating, so we have tried to make it as easy as possible! For each utility, you only have to enter two numbers: the dollar amount of the bill and the units of energy consumed; these columns are highlighted in green. All the other information calculates for you.
Note that often houses of worship have more than one meter and thus multiple bills for a particular utility. Each worksheet provides two sets of columns; it is rare there are more than two meters.
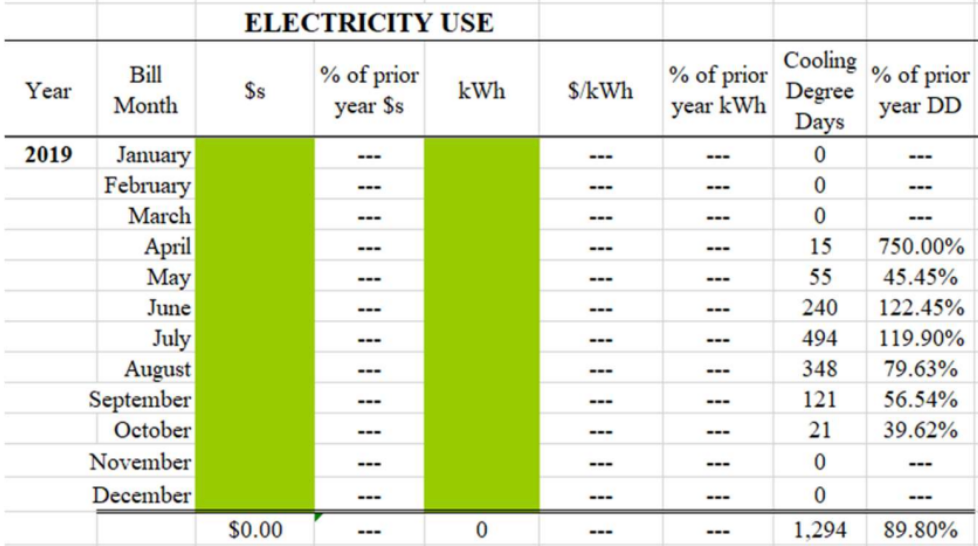
The spreadsheet for electricity looks like this, before data entry:
Each month when the bill arrives, enter the bill amount in the '$s' column, and the units of energy (for electricity it is kilowatt hours, or kWh) in the kWh column. For each form of energy you use, the process is similar: gas is typically billed in therms; oil, propane, and water typically in gallons. Of course, if you don't use a particular type of energy, you can ignore that worksheet.
Once all the data are entered (see the example below), focus on the energy use, not cost, so you can begin to see long-term trends and patterns. Likely electricity use is consistently higher during the darker winter months (due to lighting) and the hottest part of the summer (due to air conditioning); consider what you can do to lessen usage in these periods. Similarly, gas, oil, or propane costs are higher during the winter heating season so you should consider actions like adding insulation, replacing windows (or installing window inserts), upgrading the heating system, install a smart thermostat, or a combination of all these! If the water your usage spikes in a particular month but you can't explain it, then perhaps there is a faucet that drips or a toilet that leaks and needs a new flush valve. These long term tables identify periods that are out-of-pattern and should prompt you to investigate and correct the problem. Continuing to input the information each month allows you to measure the difference the action has made.
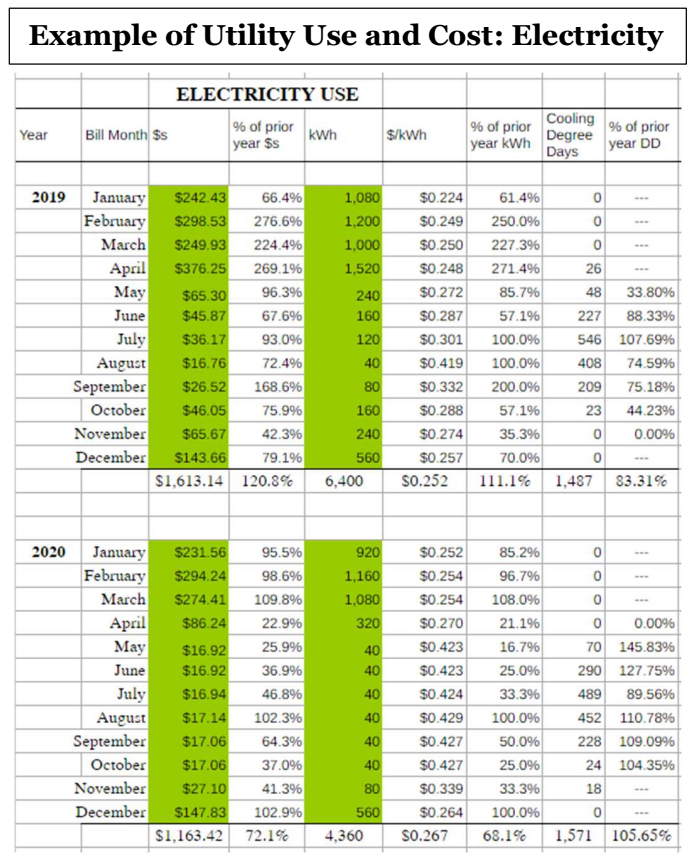
Temperatures vary from year to year. Some winters are colder than others and some summers are hotter. Degree Days allow you to compare changes in energy use with these seasonal changes to show if energy use changes are weather related instead of changes in usage. In the example above, this house of worship used 11% more electricity in 2019 compared to 2020 even though the Cooling Degree Days were 83% (ie, 17% less) of the prior year: they didn't need as much air conditioning, but still used more electricity. In 2020, they used 68% of the amount of electricity they had used in 2019 even though the number of Cooling Degree Days was 5.65% higher; the most likely explanation in this case is that the building was used less due to restrictions from the Covid-19 pandemic. The spreadsheet has historical degree data in it already and the Degree Days sheet has a link to a website and instructions so you can update them regularly.
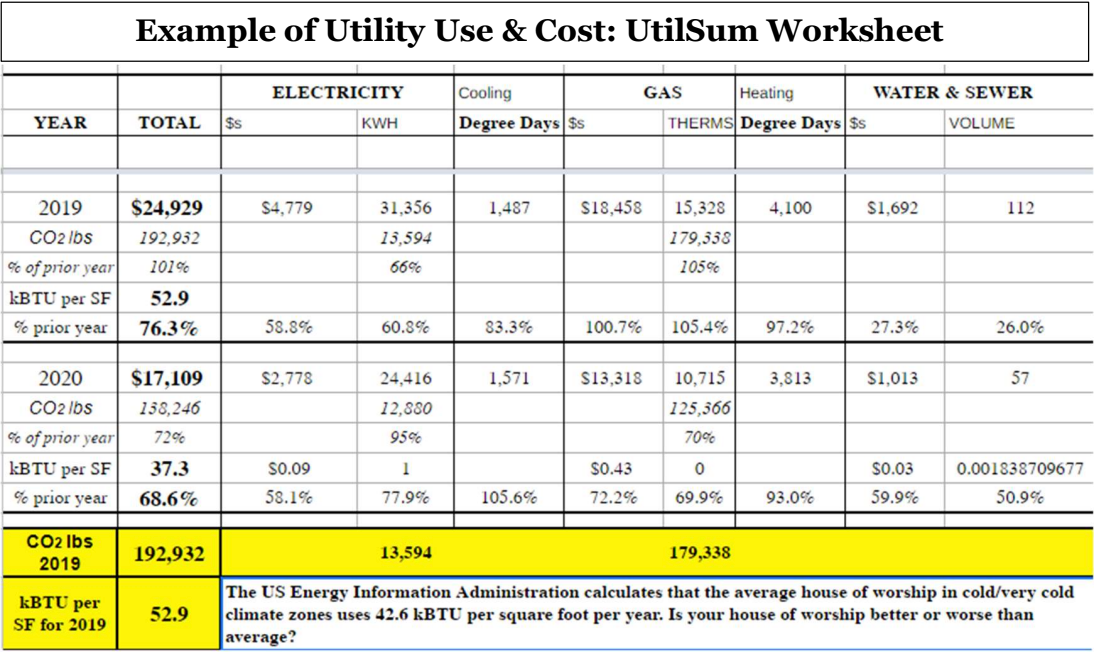
The UtilSum spreadsheet links to all the other sheets and pulls summary data into one convenient place. You can see how much you spend on all energy sources combined. Many people have never done this and are surprised to see the total.
This sheet gives you another important measurement of the impact of your energy use: carbon footprint. All fossil fuels – heating oil, natural gas, and propane emit carbon dioxide into the atmosphere when they are burned; most electricity is still generated with fossil fuels so electricity also has a carbon footprint. In this example, the house of worship heats with natural gas and has air conditioning only in the offices, for a total of 192,932 pounds of CO2 emitted by their energy use. Natural gas is the vast majority of their carbon emissions. Knowing this the house of worship can focus on projects such as better insulation or upgrading their heating system -- either to a more efficient one or ideally to an air source heat pump which runs on electricity – to reduce this source of carbon emissions.
Another useful benchmark is the "kBTU per square foot" metric, which is known in the energy efficiency industry as "energy use intensity" or EUI. At 52.9 kBTU per square foot per year, this house of worship uses 24% more energy than the average house of worship in this climate zone. This indicates they should investigate and implement energy-saving measures to bring them down to – or even better, below – the average.
Now that you know how much you spend on energy and what types of energy you use most, an energy assessment will give you specifics about which areas of your energy use can be reduced, which appliances can be replaced, etc. In Massachusetts, Eversource, National Grid, and Unitil offer free energy assessments as part of the MassSave program; call your electric or gas company's customer service line or go to http://www.masssave.com/ to find out more. If you are served by a municipal electric company, call their office to see if they offer a similar assessment -- many do. Not only will the assessor tell you where you can reduce your energy usage and bills, but there are usually rebates or other incentives that can pay for much of the recommended work!
For more information on home energy audits, get MassIPL's Everyday Environmental Stewardship report for Home Energy Audits at https://www.massipl.org/everyday-environmental-stewardship.
Want to print, share, or view this article offline? Click the link below to download it as stand-alone file.

Step-by-step guidance on adding storm windows where replacing a window is impossible, impractical, or expensive.
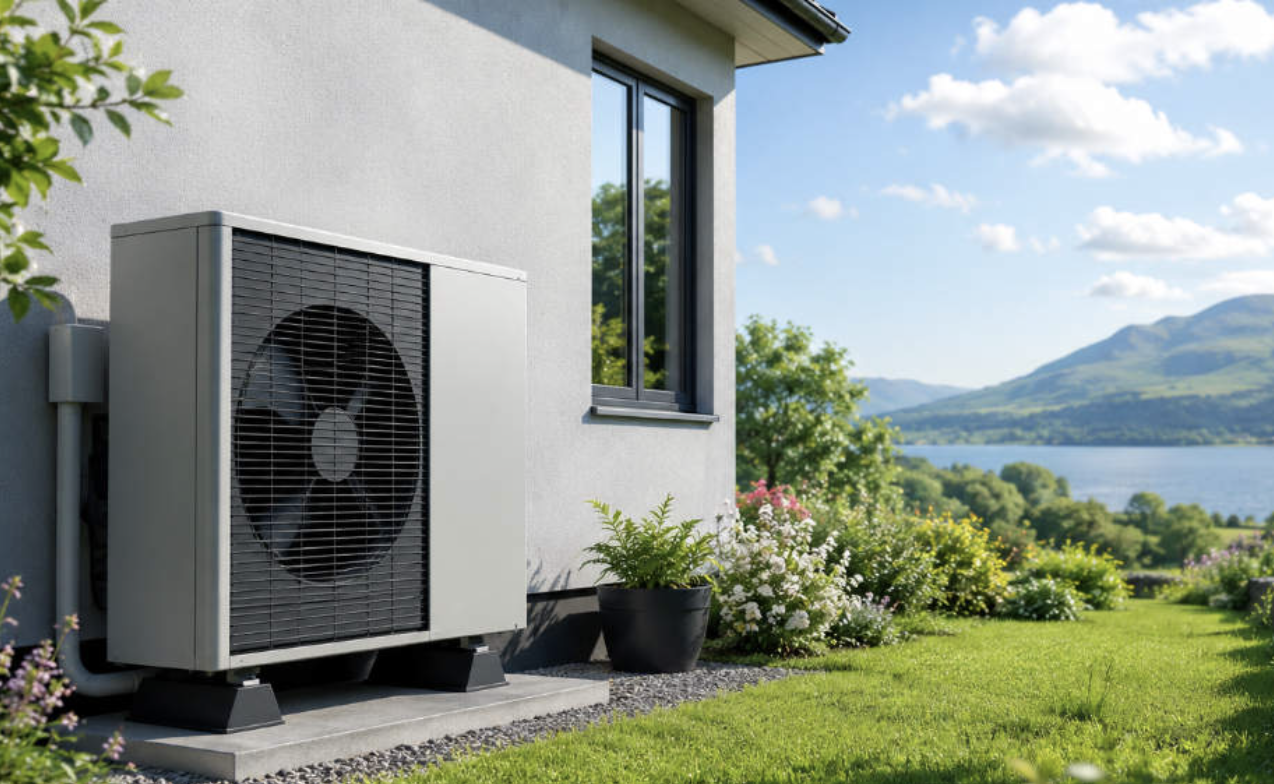
Recent efficiency gains make air-source heat pumps an excellent choice when it is time to replace a boiler or furnace. See how their cost and carbon footprint compare with oil or gas.

How to create a self-funding budget line for energy and water improvements, then reinvest the savings into future upgrades.

